In this article, you will learn how to represent the data in React Js in Charts of various types with examples including Line charts, Bar charts, Pie charts, Polar Area charts, Radar charts, Doughnut charts, Step charts, Bubble charts and Scatter Plot chart.
For our charting needs, we will use one of the most popular and feature full Chart.js library which is exclusively adapted for React named React-Chartjs-2.
What is React Chartjs 2?
React-chartjs-2 is a fully loaded library that helps to easily create complex charts and is backed by Chart.js which is fully adapted for React Js. We can create a wide variety of Chart representation that supports interactive features, responsive designs, and high flexibility for customization.
Let’s move forward and see how we can easily start using charts in React js app using the react-chartjs-2 library.
How to Add React-Chartjs-2 Charts in React Js Application?
Follow these quick steps to create various types of charts in React js application:
Step 1 – Create React js Application
Step 2 – Install React Chartjs 2 and Chart js Library
Step 3 – Configure and Register Chart Js in App
Step 4 – Start Creating Variour Charts Components
Step 5 – Integrate Chart Components into App
Step 6 – Run the Application
Step 1 – Create React js Application
First, let’s create a new React application by executing the create-react-app command as shown below:
npx create-react-app react-charts-example
Thereafter enter the application directory:
cd react-charts-example
Step 2 – Install React Chartjs 2 and Chart js Library
Now, we will install the core chart.js library with its React adaptor library named react-chartjs-2 by executing the below npm command:
npm install react-chartjs-2 chart.js --save
Step 3 – Configure and Register Chart Js in App
To use any of the charts from the library, we first need to register the chart.js components by importing the registerables from chart.js/auto. We can include it inside the component where are using the chart js component like Line or Bar etc.
In our case, we will import all the Chart components into App, so we will be adding them at the top of the App component file ~src/App.js as shown below:
import { Chart, registerables } from "chart.js/auto";

Chart.register(...registerables);
function App() {
  return (
    <div className="App">
      {/* CHART COMPONENTS HERE */}
    </div>
  );
}

export default App;
Step 4 – Start Creating Variour Charts Components
Thereafter, we are ready to create the various chart components that we will be going to create inside the ~src directory. We will be creating the following chart types in our example application:
- Line Chart
- Bar Chart
- Pie Chart
- Polar Area Chart
- Radar Chart
- Doughnut Chart
- Step Chart
- Bubble Chart
- Scatter Plot Chart
Each of the chart components will have its own data object to carry the labels, datasets and their respective option configurations.
Let’s create these component files one by one and keep them inside the ~ser directory with the provided name of the file and its component.
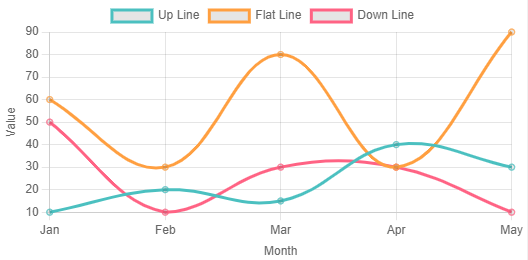
Line Chart
Create a new component file name ~src/LineChart.js and update it with the following content in it:
import React from "react";
import { Line } from "react-chartjs-2";

const data = {
  labels: ["Jan", "Feb", "Mar", "Apr", "May"],
  datasets: [
    {
      label: "Up Line",
      data: [10, 20, 15, 40, 30],
      borderColor: "rgba(75, 192, 192, 1)", // Customize line color
      fill: false,
      tension: 0.4, // Adjust line tension for smoother curves
    },
    {
      label: "Flat Line",
      data: [60, 30, 80, 30, 90],
      borderColor: "rgba(255, 159, 64, 1)", // Customize line color
      fill: false,
      tension: 0.4,
    },
    {
      label: "Down Line",
      data: [50, 10, 30, 30, 10],
      borderColor: "rgba(255, 99, 132, 1)", // Customize line color
      fill: false,
      tension: 0.4,
    },
  ],
};

const options = {
  scales: {
    x: {
      display: true,
      title: {
        display: true,
        text: "Month",
      },
    },
    y: {
      display: true,
      title: {
        display: true,
        text: "Value",
      },
    },
  },
};

const LineChart = () => {
  return (
    <div>
      <Line data={data} options={options} />
    </div>
  );
};

export default LineChart;
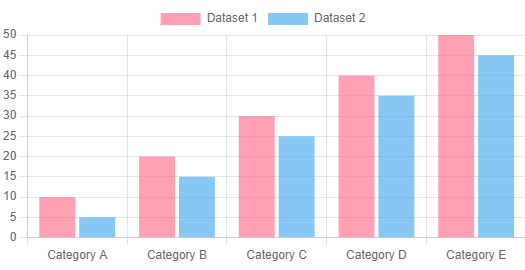
Bar Chart
Create a new component file name ~src/LineChart.js and update it with the following content in it:
import React from "react";
import { Bar } from "react-chartjs-2";

const data = {
  labels: [
    "Category A",
    "Category B",
    "Category C",
    "Category D",
    "Category E",
  ],
  datasets: [
    {
      label: "Dataset 1",
      data: [10, 20, 30, 40, 50],
      backgroundColor: "rgba(255, 99, 132, 0.6)", // Customize bar color
    },
    {
      label: "Dataset 2",
      data: [5, 15, 25, 35, 45],
      backgroundColor: "rgba(54, 162, 235, 0.6)", // Customize bar color
    },
    // Add more datasets as needed
  ],
};

const BarChart = () => {
  return (
    <div>
      <Bar data={data} />
    </div>
  );
};

export default BarChart;
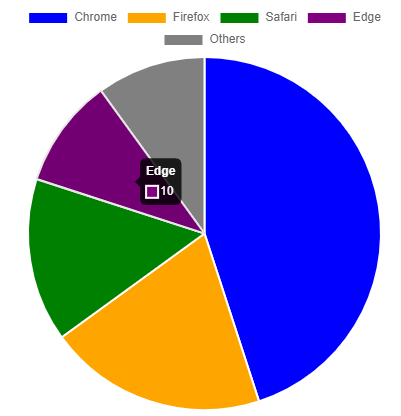
Pie Chart
Create a new component file name ~src/LineChart.js and update it with the following content in it:
import { Pie } from "react-chartjs-2";

const data = {
  labels: ["Chrome", "Firefox", "Safari", "Edge", "Others"],
  datasets: [
    {
      data: [45, 20, 15, 10, 10],
      backgroundColor: ["blue", "orange", "green", "purple", "gray"],
    },
  ],
};

const PieChart = () => {
  return (
    <div>
      <Pie data={data} />
    </div>
  );
};

export default PieChart;
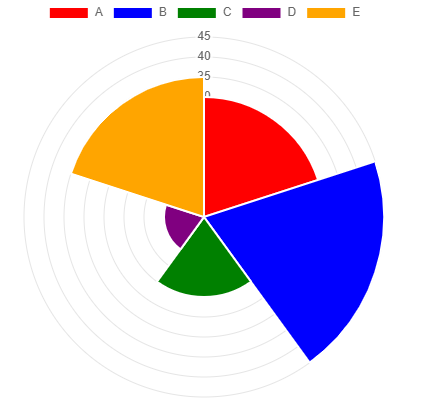
Polar Area Chart
Create a new component file name ~src/LineChart.js and update it with the following content in it:
import { PolarArea } from "react-chartjs-2";

const data = {
  labels: ["A", "B", "C", "D", "E"],
  datasets: [
    {
      data: [30, 45, 20, 10, 35],
      backgroundColor: ["red", "blue", "green", "purple", "orange"],
    },
  ],
};

const PolarAreaChart = () => {
  return (
    <div>
      <PolarArea data={data} />
    </div>
  );
};

export default PolarAreaChart;
Radar Chart
Create a new component file name ~src/LineChart.js and update it with the following content in it:
import { Radar } from "react-chartjs-2";

const data = {
  labels: ["Math", "Science", "History", "Art", "Sports"],
  datasets: [
    {
      label: "Student A",
      data: [90, 75, 80, 60, 85],
      backgroundColor: "rgba(75,192,192,0.4)",
    },
    {
      label: "Student B",
      data: [80, 85, 70, 90, 70],
      backgroundColor: "rgba(255,99,132,0.4)",
    },
  ],
};

const RadarChart = () => {
  return (
    <div>
      <Radar data={data} />
    </div>
  );
};

export default RadarChart;

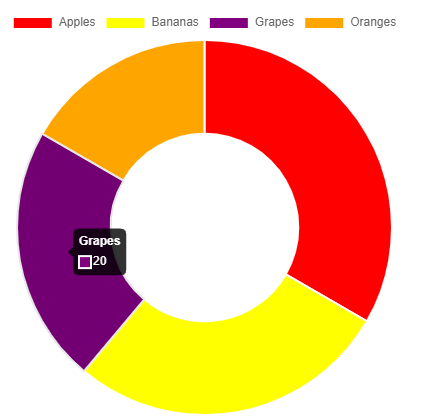
Doughnut Chart
Create a new component file name ~src/LineChart.js and update it with the following content in it:
import { Doughnut } from "react-chartjs-2";

const data = {
  labels: ["Apples", "Bananas", "Grapes", "Oranges"],
  datasets: [
    {
      data: [30, 25, 20, 15],
      backgroundColor: ["red", "yellow", "purple", "orange"],
    },
  ],
};

const DoughnutChart = () => {
  return (
    <div>
      <Doughnut data={data} />
    </div>
  );
};

export default DoughnutChart;
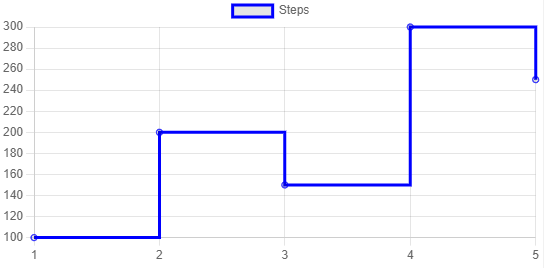
Step Chart
Create a new component file name ~src/LineChart.js and update it with the following content in it:
import { Line } from "react-chartjs-2";

const data = {
  labels: [1, 2, 3, 4, 5],
  datasets: [
    {
      label: "Steps",
      data: [100, 200, 150, 300, 250],
      borderColor: "blue",
      fill: false,
      stepped: true,
    },
  ],
};

const StepChart = () => {
  return (
    <div>
      <Line data={data} />
    </div>
  );
};

export default StepChart;
Bubble Chart
Create a new component file name ~src/LineChart.js and update it with the following content in it. Also, we have shown custom tooltip information on the hover by overriding the tooltip callback:
import React from "react";
import { Bubble } from "react-chartjs-2";

const data = {
  datasets: [
    {
      label: "Dataset 1",
      data: [
        { x: 10, y: 20, r: 15 },
        { x: 30, y: 40, r: 25 },
        { x: 50, y: 60, r: 20 },
      ],
      backgroundColor: "rgba(255, 99, 132, 0.6)", // Customize bubble color
    },
    {
      label: "Dataset 2",
      data: [
        { x: 15, y: 25, r: 10 },
        { x: 35, y: 45, r: 18 },
        { x: 55, y: 65, r: 22 },
      ],
      backgroundColor: "rgba(54, 162, 235, 0.6)", // Customize bubble color
    },
    // Add more datasets as needed
  ],
};

const options = {
  scales: {
    x: {
      type: "linear",
      position: "bottom",
    },
    y: {
      type: "linear",
      position: "left",
    },
  },
  tooltips: {
    callbacks: {
      label: (tooltipItem, data) => {
        const datasetLabel =
          data.datasets[tooltipItem.datasetIndex].label || "";
        const value =
          data.datasets[tooltipItem.datasetIndex].data[tooltipItem.index];
        return `${datasetLabel}: (${value.x}, ${value.y}), Radius: ${value.r}`;
      },
    },
  },
};

const BubbleChart = () => {
  return (
    <div>
      <Bubble data={data} options={options} />
    </div>
  );
};

export default BubbleChart;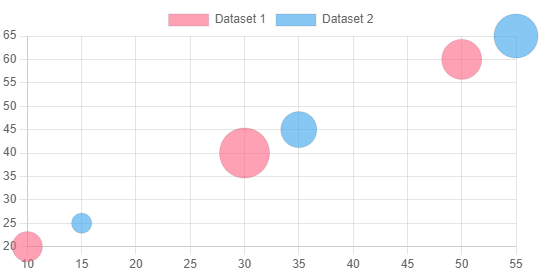
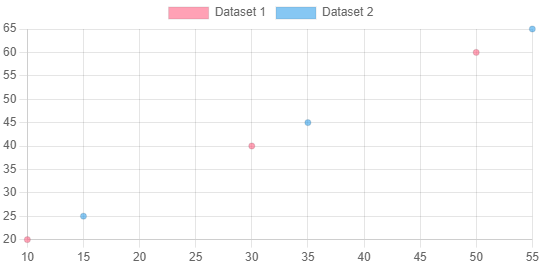
Scatter Plot Chart
Create a new component file name ~src/LineChart.js and update it with the following content in it:
import React from "react";
import { Scatter } from "react-chartjs-2";

const data = {
  datasets: [
    {
      label: "Dataset 1",
      data: [
        { x: 10, y: 20 },
        { x: 30, y: 40 },
        { x: 50, y: 60 },
      ],
      backgroundColor: "rgba(255, 99, 132, 0.6)", // Customize point color
    },
    {
      label: "Dataset 2",
      data: [
        { x: 15, y: 25 },
        { x: 35, y: 45 },
        { x: 55, y: 65 },
      ],
      backgroundColor: "rgba(54, 162, 235, 0.6)", // Customize point color
    },
    // Add more datasets as needed
  ],
};

const options = {
  scales: {
    x: {
      type: "linear",
      position: "bottom",
    },
    y: {
      type: "linear",
      position: "left",
    },
  },
  tooltips: {
    callbacks: {
      label: (tooltipItem, data) => {
        const datasetLabel =
          data.datasets[tooltipItem.datasetIndex].label || "";
        const value =
          data.datasets[tooltipItem.datasetIndex].data[tooltipItem.index];
        return `${datasetLabel}: (${value.x}, ${value.y})`;
      },
    },
  },
};

const ScatterChart = () => {
  return (
    <div>
      <Scatter data={data} options={options} />
    </div>
  );
};

export default ScatterChart;
Step 5 – Integrate Chart Components into App
After creating the Chart components, we will put them all in the App.js file to render the App component at once in React app:
import { Chart, registerables } from "chart.js/auto";
import BarChart from "./BarChart";
import LineChart from "./LineChart";
import PieChart from "./PieChart";
import PolarAreaChart from "./PolarAreaChart";
import RadarChart from "./RadarChart";
import DoughnutChart from "./DoughnutChart";
import StepChart from "./StepChart";
import BubbleChart from "./BubbleChart";
import ScatterPlotChart from "./ScatterPlotChart";

Chart.register(...registerables);
function App() {
  return (
    <div className="App">
      <LineChart />
      <BarChart />
      <PieChart />
      <PolarAreaChart />
      <RadarChart />
      <DoughnutChart />
      <StepChart />
      <BubbleChart />
      <ScatterPlotChart />
    </div>
  );
}

export default App;
Step 6 – Run the Application
Now, you are ready to run the application by hitting the npm start to see it working and creating various charts in the view
Conclusion
We have successfully implemented the Chart js into our React application with the help of React-Chartjs-2 the library. We created various types of charts including Line charts, Bar charts, Pie charts, Polar Area charts, Radar charts, Doughnut charts, Step charts, Bubble charts and Scatter Plot charts with their own components. Thereafter we put them into the App component to show them all at once. We also got to know how to register charts before using them inside the App component, but in your case to can keep them at the place where you use the chart components. Hope this will be helpful.
Leave a Reply