In this guide, you will learn how to create a Guage Chart or Speedometer Chart with a needle to point a value. For Gauge Chart we will be using the react-gauge-chart library and also discuss its various props and how to create a live updating gauge chart to update the value with animation.
Where a Gauge Type Chart is Used?
A gauge chart is also known as a dial or speedometer chart that displays a single value on a circular scale. Generally, it is used to represent a value within a specific range and provides a visual indication of where a current value lies in that scale. This type of chart can be used for Progress Tracking, Performance Metrics, Health Monitor, Quality Control etc.
How to Create Gauge Chart in React Js using react-gauge-chart?
Follow these steps to create a Gauge chart and how to customize its various properties:
Step 1 – Create React App
Step 2 – Install React Gauge Chart Library
Step 3 – Create a Gauge Chart
Step 4 – Various Configurations
Step 5 – Run the Application
Step 1 – Create React App
To start, let’s create a new React project using the following command:
npx create-react-app react-gauge-chart-appThis command will create a new React project named react-gauge-chart-app in the current directory.
Next, navigate to the project folder:
cd react-gauge-chart-app
Step 2 – Install React Gauge Chart Library
After creating the Rect app, next we will install the React Gauge Chart library. Execute the following npm command to install the package:
npm install react-gauge-chart
Step 3 – Create a Gauge Chart
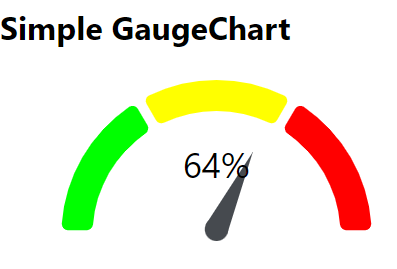
We can easily create the simplest Gauge Chart by adding the GaugeChart component as shown below:
import React from "react";
import GaugeChart from "react-gauge-chart";

function App() {
  return (
    <div className="App">
      <h1>Simple GaugeChart</h1>
      <GaugeChart id="gauge-chart1" percent={0.64} textColor="black" />
    </div>
  );
}

export default App;
This will be created as below:
Let’s create a new component file at this location ~src/GaugeChartExample.js and update it with the following to create live updating Gauge chart with a number of properties used:
import React, { useState, useEffect } from "react";
import GaugeChart from "react-gauge-chart";

const chartStyle = {
  height: 50,
};

const LiveGaugeChart = () => {
  const [value, setValue] = useState(0.5); // Initial value

  // Simulate live data updates
  useEffect(() => {
    const interval = setInterval(() => {
      const newValue = Math.random(); // Generate a random value between 0 and 1
      setValue(newValue);
    }, 3000); // Update every 2 seconds

    return () => clearInterval(interval);
  }, []);

  return (
    <div>
      <GaugeChart
        id="gauge-chart1"
        style={chartStyle}
        nrOfLevels={20}
        arcsLength={[0.2, 0.2, 0.2, 0.2, 0.2]}
        colors={["#FF5F6D", "#FFB200", "#F2FF00", "#00FFDD", "#00FF00"]}
        percent={value}
        arcPadding={0.02}
        textColor="black"
        formatTextValue={(value) => `${value.toFixed(2)}%`}
      />
    </div>
  );
};

export default LiveGaugeChart;
We have used various configuration properties in the above example:
id: A unique identifier for the chart.style: The style object defined earlier, setting the chart’s height.nrOfLevels: Number of levels or partitions in the gauge.arcsLength: An array that determines the lengths of different arcs in the gauge.colors: An array of colors for the different arcs.percent: The current value of the gauge, which is controlled by thevaluestate.arcPadding: The padding between arcs.textColor: The color of the text inside the gauge.formatTextValue: A function that formats the displayed value, in this case, it adds a “%” sign after rounding the value to 2 decimal places.
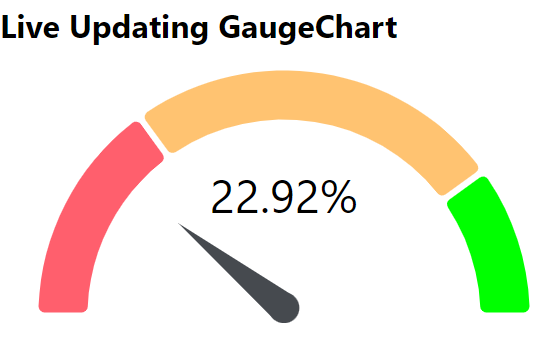
Import the above component into App component as below to see the live updating Gauge Chart:
import React from "react";
import LiveGaugeChart from './GaugeChartExample';

function App() {
  return (
    <div className="App">
      <h1>Live Updating GaugeChart</h1>
      <LiveGaugeChart />
    </div>
  );
}

export default App;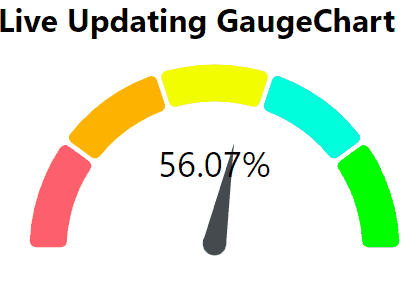
Step 4 – Various Configurations
React gauge chart provides a number of configuration options to control the behaviour and appearance. In the following chart you can find the required configuration and apply it easily:
| Name | PropType | Description | Default value |
|---|---|---|---|
| id | PropTypes.string.isRequired | Used for the identification of the div surrounding the chart | |
| className | PropTypes.string | Add className to the div container |
|
| style | PropTypes.object | Add style to the div container |
{ width: ‘100%’ } |
| marginInPercent | PropTypes.number | Margin for the chart inside the containing SVG element | 0.05 |
| cornerRadius | PropTypes.number | Corner radius for the elements in the chart | 6 |
| nrOfLevels | PropTypes.number | The number of elements displayed in the arc | 3 |
| percent | PropTypes.number | The number where the pointer should point to (between 0 and 1) | 0.4 |
| arcPadding | PropTypes.number | The distance between the elements in the arc | 0.05 |
| arcWidth | PropTypes.number | The thickness of the arc | 0.2 |
| colors | PropTypes.array | An array of colors in HEX format displayed in the arc | [“#00FF00”, “#FF0000”] |
| textColor | PropTypes.string | The color of the text | “#FFFFFF” |
| needleColor | PropTypes.string | The color of the needle triangle | “#464A4F” |
| needleBaseColor | PropTypes.string | The color of the circle at the base of the needle | “#464A4F” |
| hideText | PropTypes.bool | Whether or not to hide the percentage display | false |
| arcsLength | PropTypes.array | An array specifying the length of each individual arc. If this prop is set, the nrOfLevels prop will have no effect | none |
| animate | PropTypes.bool | Whether or not to animate the needle when loaded | true |
| animDelay | PropTypes.number | Delay in ms before starting the needle animation | 500 |
| animateDuration | PropTypes.number | Duration in ms for the needle animation | 3000 |
| formatTextValue | PropTypes.func | Format you own text value (example: value => value+’%’) | null |
Step 5 – Run the Application
Now run the application to see the Live Updating Gauge chart rendered on your application view. Execute the npm start command to see the implementation working.