Graphical representation of data leaves a long lasting picture with better understanding. Sometimes we may need to use graphs and charts to better implement data in web applications.
During my research for some project, I came across with such beautiful chart plugins. Here are some top chart libraries.
1) D3.js – Data-Driven Documents – D3 is Javascript library for building very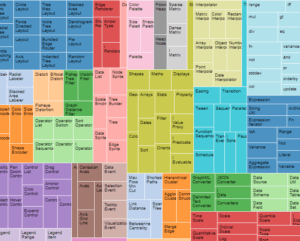 complex and custom SVG visualizations as per requirement. D3 acts as a building block for creating beautiful charts or graphs. This library is not having any limitation. But It may take some time to generate charts as it needs some time to use given functions for generating charts.
Link – https://d3js.org/
Pricing – Free
2) NVD3 – This library uses D3 and provides already build ready to use charts. It
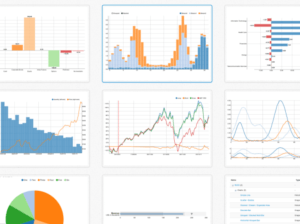
includes generally required chart types like Bar, Pie, Columns etc. NVD3 is a great option if you want the beauty of D3 and have a shortage of time.
Link – http://nvd3.org/
Link( AngularJS ) – http://krispo.github.io/angular-nvd3/
Pricing – Free
3) C3js – Like NVD3, C3js also provides pre build charts which are ready to use.
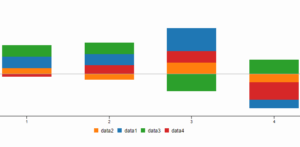
These are also using D3 as a base library. C3js also provides a wide variety of charts with different types.
Link – http://c3js.org/
Link( AngularJS ) – https://www.npmjs.com/package/c3-angularjs
Pricing – Free
4) Chartist – Chartist is also a great library, these
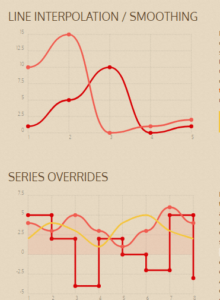 provide very simple clean SVG charts with very bright and good looking colors.
Link – https://gionkunz.github.io/chartist-js/
Link( Angularjs ) – https://github.com/willsoto/angular-chartist.js
Pricing – Free
5) Canvasjs – CanvasJs charts are supported on multiple platforms including  iPhone, iPad, Android, Desktops. These having wide variety of charts including Pie, Bar, Columns, Waterfall, Revenue Bridge Charts.
Link – https://canvasjs.com/
Link( Angularjs ) – https://github.com/Traperto/CanvasJS-AngularJS-Directive
Pricing – Limited Usage with Paid plans.