Next js provides a number of features which helps to create a robust application. One such feature is getServerSideProps, which is a data fetching method that runs on the server side every time we make a request.
This article will walk you through various methods and techniques on how to debug getServerSideProps in Next.js with examples.
What is getServerSideProps?
In Next.js, getServerSideProps is a special function that we can include in our page components which get called at the time of each request and allow us to fetch data required for rendering the page.
The speciality of getServerSideProps is that it can run only on the server-side. This means that the data fetched by getServerSideProps can be directly included in the HTML sent to the client. This proves helpful for SEO purposes and for displaying dynamic data that can change frequently between requests.
Have a look at a basic example of how getServerSideProps is used:
import fetch from 'node-fetch';
function Posts({ posts }) {
return (
<div>
<h1>List of Posts</h1>
{posts.map((post) => (
<div key={post.id}>
<h2>{post.title}</h2>
<p>{post.body}</p>
</div>
))}
</div>
);
}
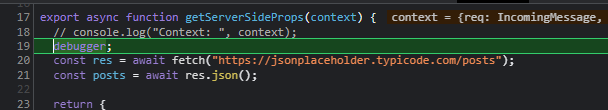
export async function getServerSideProps() {
const res = await fetch('https://jsonplaceholder.typicode.com/posts');
const posts = await res.json();
return {
props: {
posts,
},
};
}
export default Posts;
Common Issues with Debugging getServerSideProps
Sometimes debugging getServerSideProps in Next.js can be a challenging task. One common issue we may face is understanding the context in which getServerSideProps is running. Browser-based debugging tools might not be helpful as it runs on the server side.
Another common issue is while dealing with asynchronous operations as getServerSideProps is an async function, so handling errors and understanding the flow of data can be tricky.
At last, as getServerSideProps runs for every request, its impact on performance and optimisation is where developers often struggle.
We will explore various techniques to debug getServerSideProps and try to overcome these challenges.
Why I am unable to see console.log() and debugger but nothing is working for me?
The console.log and debugger statements in your getServerSideProps function are server-side code. This means they execute on the server, not in the browser.
Here’s how you can see the output of console.log and use the debugger statement:
For console.log:
The output of console.log will appear in the terminal where you started your Next.js server, not in the browser console. If you’re using a command like npm run dev or yarn dev to start your server, check the terminal for the output.
For debugger:
The debugger statement is a breakpoint for the debugger. However, it only works if you’ve started your application in debug mode. Here’s how you can do it:
Step 1 – Start your Next.js application in debug mode. You can do this by adding a debug script to your package.json:
"scripts": {
  "dev": "next dev",
  "build": "next build",
  "start": "next start",
  "debug": "NODE_OPTIONS='--inspect' next dev"
}
Then, run npm run debug or yarn debug to start your application in debug mode.
Note: In Windows OS , you may see this issue “‘NODE_OPTIONS’ is not recognized as an internal or external command,”
In Windows systems the syntax for setting environment variables is different from Unix-based systems like Linux or macOS.
On Windows, you can use the cross-env package to set environment variables in a way that works across all platforms. Here’s how you can do it:
Install cross-env in your project:
npm install --save-dev cross-env
Then update the package as shown below:
"debug": "cross-env NODE_OPTIONS='--inspect' next dev"
Step 2 – Open Chrome and navigate to chrome://inspect.
Step 3 – Click on the “Open dedicated DevTools for Node” link.
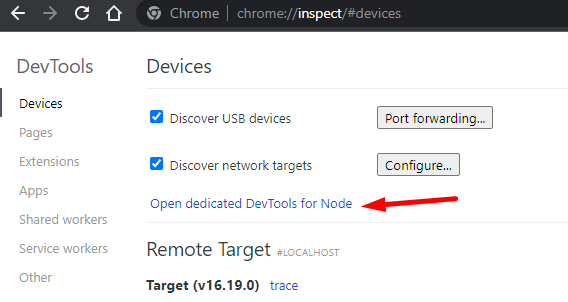
Step 4 – Your application should appear under “Remote Target”. Click “inspect” to open a debugging session.
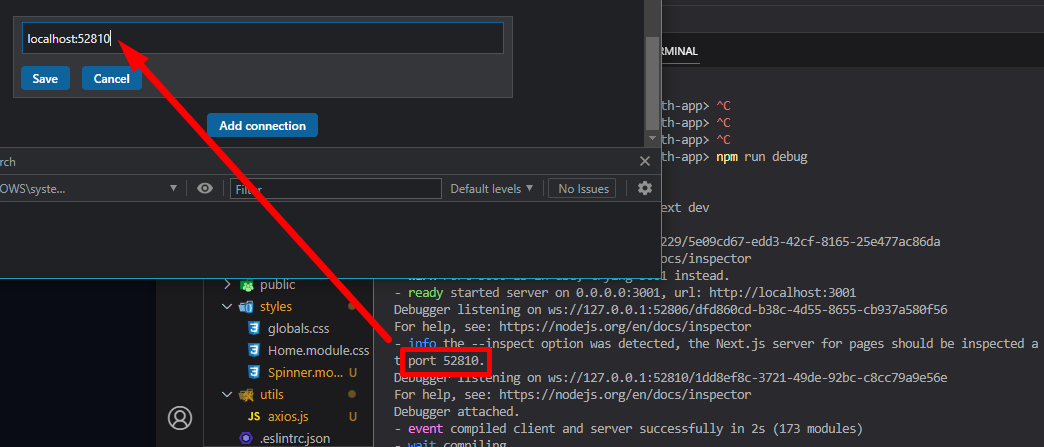
Now, when your application hits the debugger statement, execution will pause and you can inspect your application state in the Chrome DevTools.
Remember, debugging is an art that requires practice. The more you debug, the better you’ll get at understanding and fixing the issues in your code. Happy debugging!