In this article, we will create a Heatmap as we see in GitHub, where data is shown in a table-like format having horizontal and vertical lines of boxes, each box represents a day and we can have different visual colors of each box based on the count of data in it.
To create HeatMap in React js, we will use the React-Calendar Heatmap plugin, which provides a number of configuration options to easily implement the heatmap data. In our example application, we will create a reusable component in which we can pass the data to create a heatmap.
The Heatmap created by using the react-calendar-heatmap provides a number of callback event handlers like click, mouse-in, mouse-out etc that can be used to add interactive behaviour.
Let’s start the implementation
How to Add Heatmap in React Js with Days?
Follow these quick steps to create a heatmap chart in React application:
Step 1 – Install Required Libraries
Step 2 – Create Heatmap Component
Step 3 – Import Heatmap Component into App
Step 4 – Add CSS Style for Heatmap
Step 5 – Run the Application
Step 1 – Install Required Libraries
In React application, to use Heatmap and Tooltip on each Heatmap box, we need to instal the React Calendar HeatMap and React Tooltip plugins.
npm install react-calendar-heatmap react-tooltip@4
Step 2 – Create Heatmap Component
Now, we will create the dedicated Heatmap component at this location ~src/HeatMapExample.js in the project structure.
Update the component file with the following content in it:
import React from "react";
import ReactCalendarHeatmap from "react-calendar-heatmap";
import ReactTooltip from "react-tooltip";
import "react-calendar-heatmap/dist/styles.css";

const InteractiveHeatmap = ({
  values,
  startDate,
  endDate,
  onClick,
  onMouseOver,
  onMouseLeave,
  classForValue,
  tooltipDataAttrs,
}) => {
  return (
    <div className="interactive-heatmap-container">
      <ReactCalendarHeatmap
        startDate={startDate}
        endDate={endDate}
        values={values}
        classForValue={classForValue}
        onClick={onClick}
        onMouseOver={onMouseOver}
        onMouseLeave={onMouseLeave}
        tooltipDataAttrs={tooltipDataAttrs}
      />
      <ReactTooltip />
    </div>
  );
};

export default InteractiveHeatmap;
We have named this as InteractiveHeatmap as we have added various event handlers like Click, OnMouseOver and OnMouseLeave. With that we also have the Tooltip enabled where the user can see the details of the box on hover inside a tooltip. For creating the tooltip, we used the ReactTooltip component from react-tooltip package.
This component is getting all of the configuration props including even handlers and data from its parent component. Which we will see in the next section.
Step 3 – Import Heatmap Component into App
In the App component, we are dynamically generating the random data on the button click on checking the Start and End date provided for the heatmap. We have generateRandomData method to generate that data from generateDateRange function in turn.
The getColorForCount helps to add the color class based on the scale of values passed on a day box. We have defined callback events for Click, MouseOver, MouseLeave which we are passing as props.
Tooltip content is getting updated by using a combination of MouseOver, MouseLeave and getTooltipDataAttrs methods.
Open the App.js file and update it with the following:
import React, { useState } from "react";
import InteractiveHeatmap from "./HeatMapExample";
import "./App.css";

const startDate = new Date("2023-01-01");
const endDate = new Date("2023-12-31");

function generateDateRange(start, end) {
  const dateRange = [];
  let currentDate = new Date(start);

  while (currentDate <= end) {
    dateRange.push(new Date(currentDate));
    currentDate.setDate(currentDate.getDate() + 1);
  }

  return dateRange;
}

const allDates = generateDateRange(startDate, endDate);

const getColorForCount = (count) => {
  const colorClasses = [
    "color-scale-1",
    "color-scale-2",
    "color-scale-3",
    "color-scale-4",
    "color-scale-5",
  ];
  return colorClasses[count - 1] || "color-empty";
};

const generateRandomData = () => {
  const newData = allDates.map((date) => ({
    date: date.toISOString().split("T")[0],
    count: Math.floor(Math.random() * 5) + 1,
  }));
  return newData;
};

const App = () => {
  const [heatmapData, setHeatmapData] = useState(generateRandomData());

  const handleGenerateRandomData = () => {
    const newData = generateRandomData();
    setHeatmapData(newData);
  };

  const handleClick = (value) => {
    if (value && value.date) {
      alert(`Clicked: Date - ${value.date}, Count - ${value.count}`);
    }
  };

  const handleMouseOver = (event, value) => {
    if (value && value.date) {
      event.target.setAttribute(
        "data-tip",
        `Date: ${value.date}, Count: ${value.count}`
      );
    }
  };

  const handleMouseLeave = (event) => {
    event.target.removeAttribute("data-tip"); // Remove data-tip attribute to hide the tooltip
  };

  const classForValue = (value) => {
    if (value && value.count) {
      return getColorForCount(value.count);
    }
    return "color-empty";
  };

  const getTooltipDataAttrs = (value) => {
    // handle null value.date issue
    if (!value || !value.date) {
      return null;
    }
    // Configuration for react-tooltip
    return {
      "data-tip": `Date: ${value.date}, Count: ${value.count}`,
    };
  };

  return (
    <div className="app-container">
      <h1>Interactive Heatmap</h1>
      <button onClick={handleGenerateRandomData}>Generate Random Data</button>
      <InteractiveHeatmap
        values={heatmapData}
        startDate={startDate}
        endDate={endDate}
        onClick={handleClick}
        onMouseOver={handleMouseOver}
        onMouseLeave={handleMouseLeave}
        classForValue={classForValue}
        tooltipDataAttrs={getTooltipDataAttrs}
      />
    </div>
  );
};

export default App;
The main part of the component is how we are passing the Event handlers and values to our InteractiveHeatmap which in turn is using the ReactCalendarHeatmap component from react-calendar-heatmap library.
Other than that the dynamic data generation functions are optional and can be removed or enhanced as per requirements.
Step 4 – Add CSS Style for Heatmap
We need to add CSS style to depict colors to the day boxes into our calendar heatmap. In our case, we will add the CSS style in the App.css file:
.react-calendar-heatmap .color-scale-1 { fill: #d6e685; }
.react-calendar-heatmap .color-scale-2 { fill: #8cc665; }
.react-calendar-heatmap .color-scale-3 { fill: #44a340; }
.react-calendar-heatmap .color-scale-4 { fill: #1e6823; }
Step 4 – Run the Application
We are ready to try the implementation of the heatmap we have done so far. Execute the npm start command to see it working.
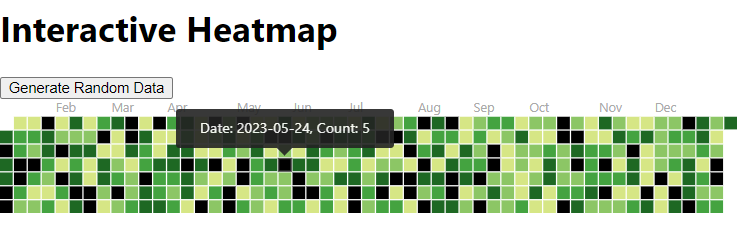
Conclusion
We have finally implemented the Calendar heatmap in our React js application using the react-calendar-heatmap plugin and also added the tooltip by using the react-tooltip library. You can easily modify the shared component according to add your own requirements.